Nenana Ice Classic

Why now?
Gambling in Alaska is strictly controlled outside of bingo and pulltabs, so the Nenana Ice Classic is one of the few sanctioned gambling outlets you can legally participate in for the state. I lived in Anchorage for 8 years and am not a big gambler. So, I didn’t participate while I lived in state, but prediction is always a fun and interesting challenge so I figured I’d finally give it a try.
Interestingly enough, I’m not the only person to attempt to take a scientific approach to predicting the ice breakup1. Tommy Lee Waters won three different years by drilling holes to measure ice thickness in the area, studying historical data and spending $5,000 on guesses. (That’s 2,000 guesses, by the way.)
Data Sources
Weather Data
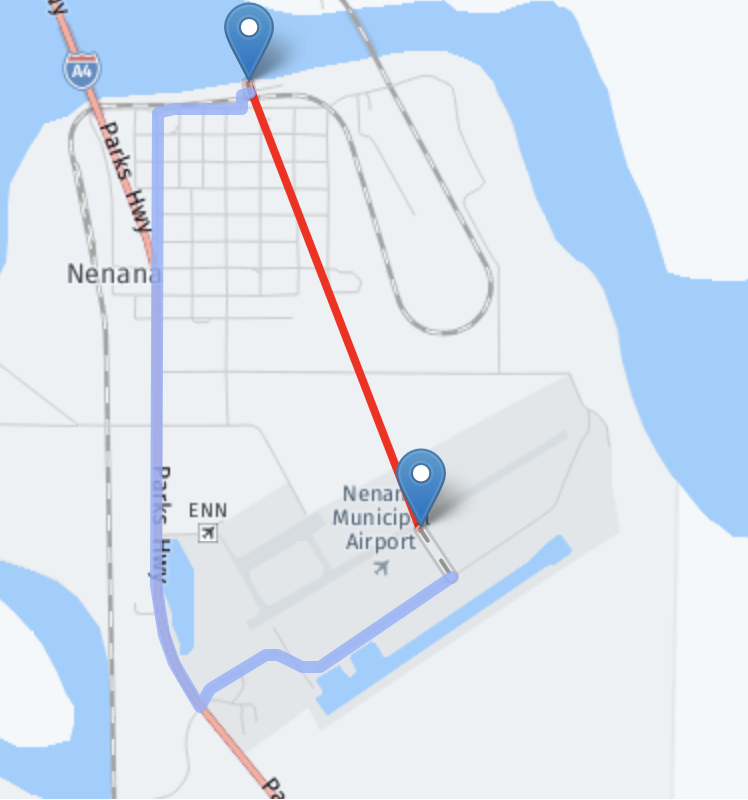
I sourced my weather data from National Centers for Environmental Information from NOAA. Daily weather data from before 1977 for Nenana, AK is quite sparse and the nearest weather station is the Nenana Municipal Airport. The weather station is reasonably close to the tripod (approximately 1.25 miles away). This is seen below, where the weather station is located at the airport and the second point is the location of the Nenana Ice Classic tripod.
Key parameters I intend to use for modelling are:
- Daily Temperature (Low, Mean and High, in °F)
- Heating Days (24h-Mean Temperature < 65°F)
- Ice Days (24h-Max Temperature < 32°F)
- Heating Degree Days (Mean Temperature Difference < 65°F)
- Modified Heating Degree Days (Mean Temperature Difference < 32°F)
National Snow and Ice Data Center
The National Snow and Ice Data Center (NSIDC) collects and shares snow and ice data from digital and analog sources. The Tenana River ice annual break up dates for Nenana, AK2 are stored by NSIDC under data set ID NSIDC-0064. This dataset contains ice breakup date of each year from 1917-2021. The date is broken down to year, month, date, time and decimal_day of the year, which represents both the day of the year and time of the day in the same record. All breakup times are logged in Alaska Standard Time.
Table 1. Example Data from the NSIDC Dataset
| Year | Month | Day | Time | Decimal Day |
|---|---|---|---|---|
| 2016 | April | 23 | 15:39:00 | 114.6521 |
| 2017 | May | 1 | 12:00:00 | 121.5000 |
| 2018 | May | 1 | 13:18:00 | 121.5542 |
| 2019 | April | 14 | 00:21:00 | 104.0146 |
| 2020 | April | 27 | 12:56:00 | 118.5389 |
| 2021 | April | 30 | 12:50:00 | 120.5347 |
I’ve plotted the Tenana River ice breakup dates for this period below, with the dates in day of the year on the left and calendar date on the right axes. The green line represents the 9-year moving average and the bold horizontal line is the mean break up date for the period, which is the 124th day of the year or May 4th.
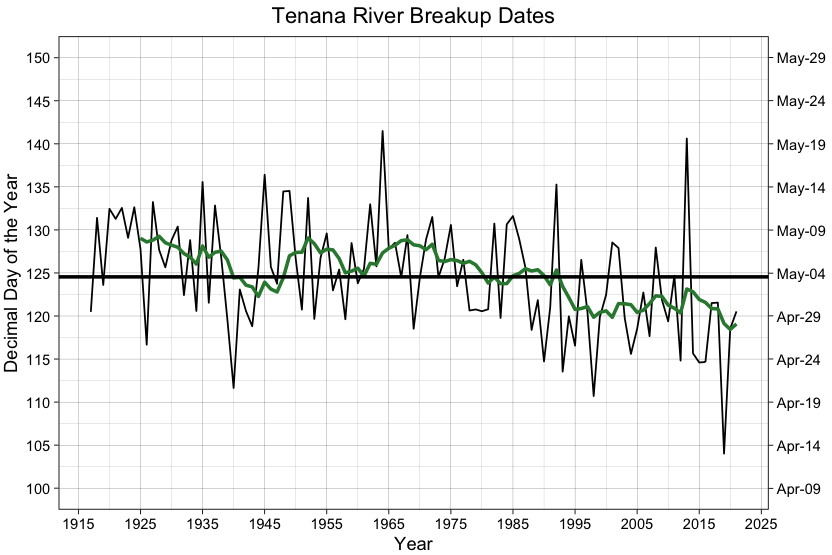
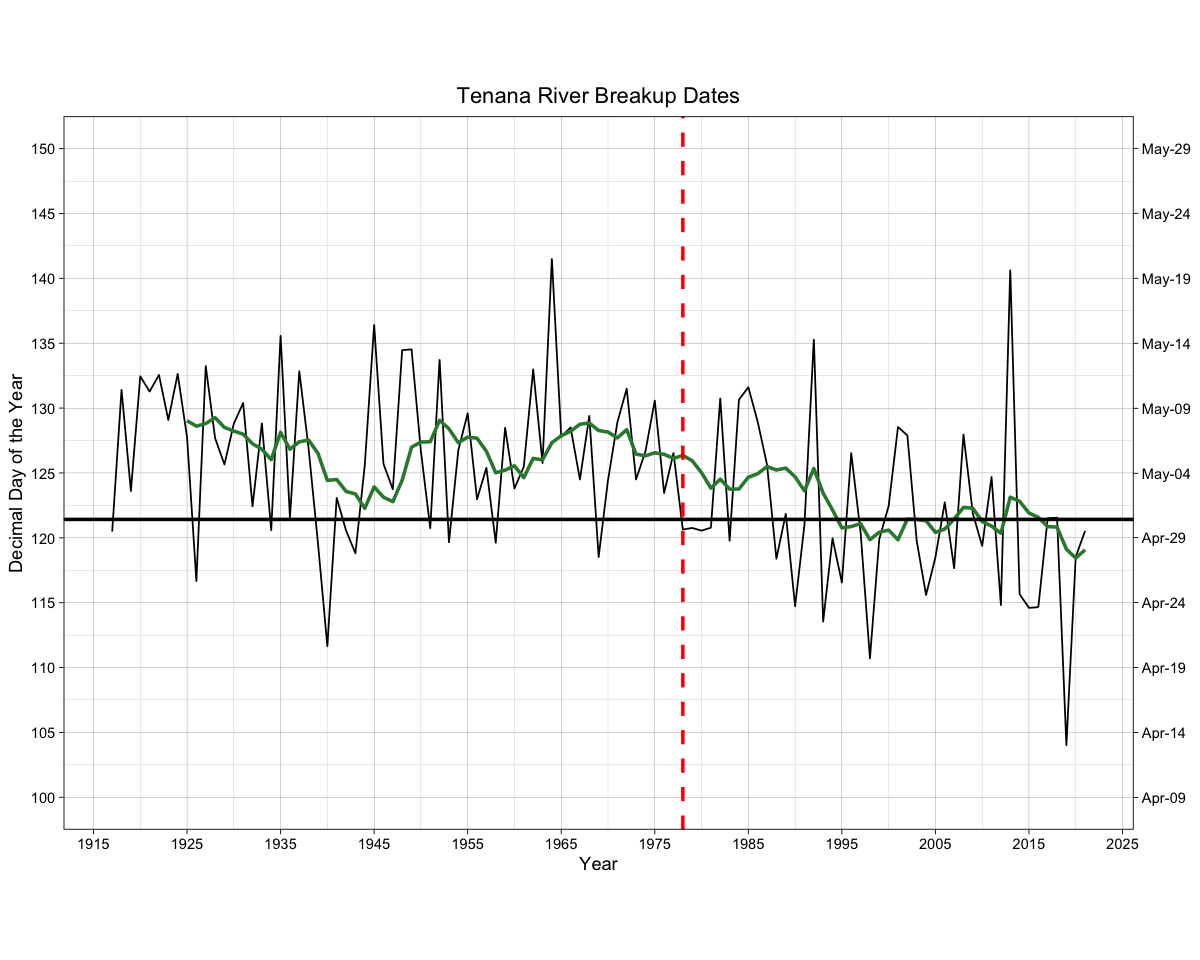
There is some drift in the data, as you can see over the course of the period that the breakup date is getting earlier and earlier in the year. This is likely due to global warming. Since weather data for Nenana is sparse before 1977, I’ll only be using weather data from then to the present. Below, I’ve replotted the Tenana River ice breakup dates. The year 1978 is marked with a vertical dashed red line, and the bold horizontal line is the mean break up date for 1978-2021 (which is the 121th day of the year, or May 1st).
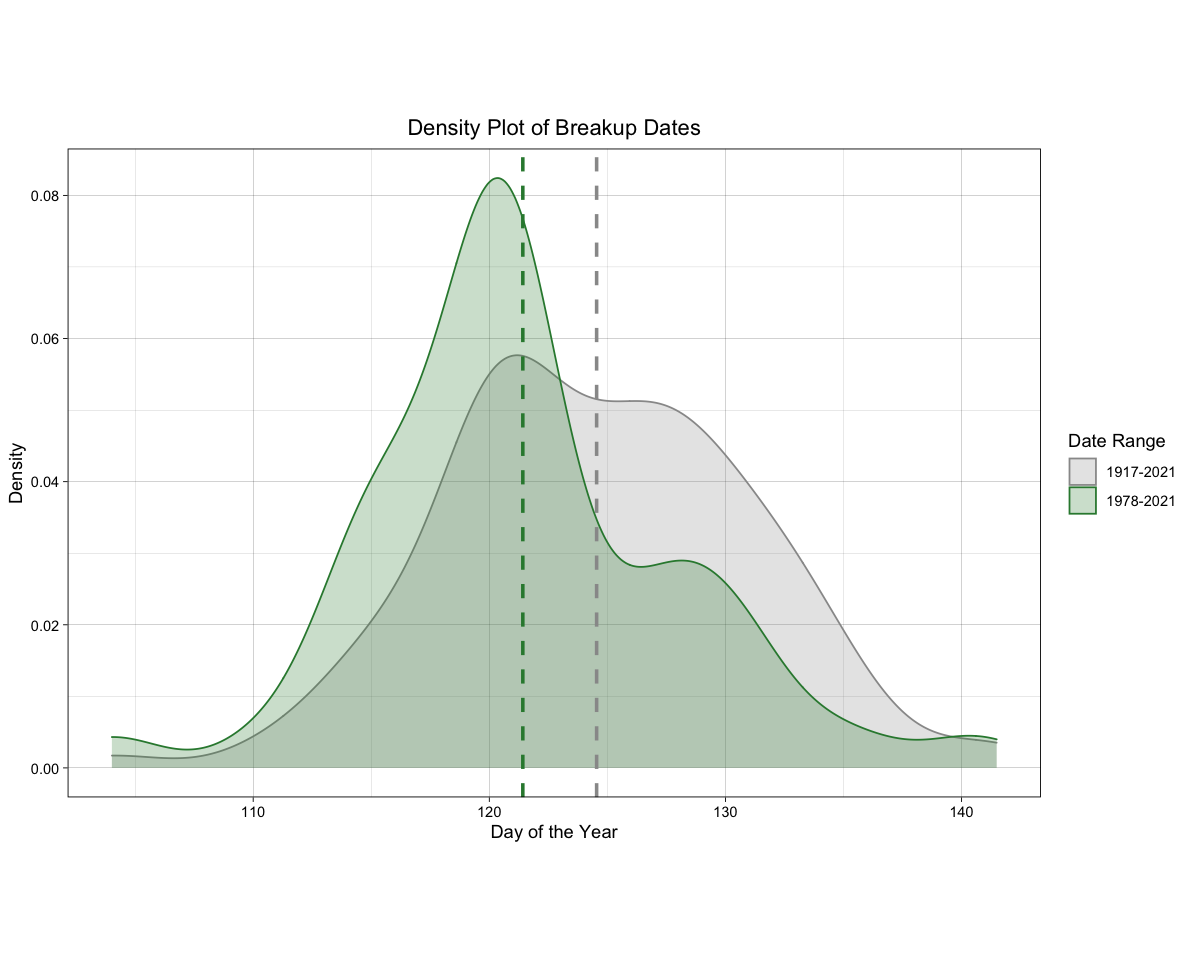
I’ve created a density plot of the breakup dates by time period below in Figure 2. You can see the mean breakup date for 1980-2021 is approximately three days earlier than the average for the entire period.
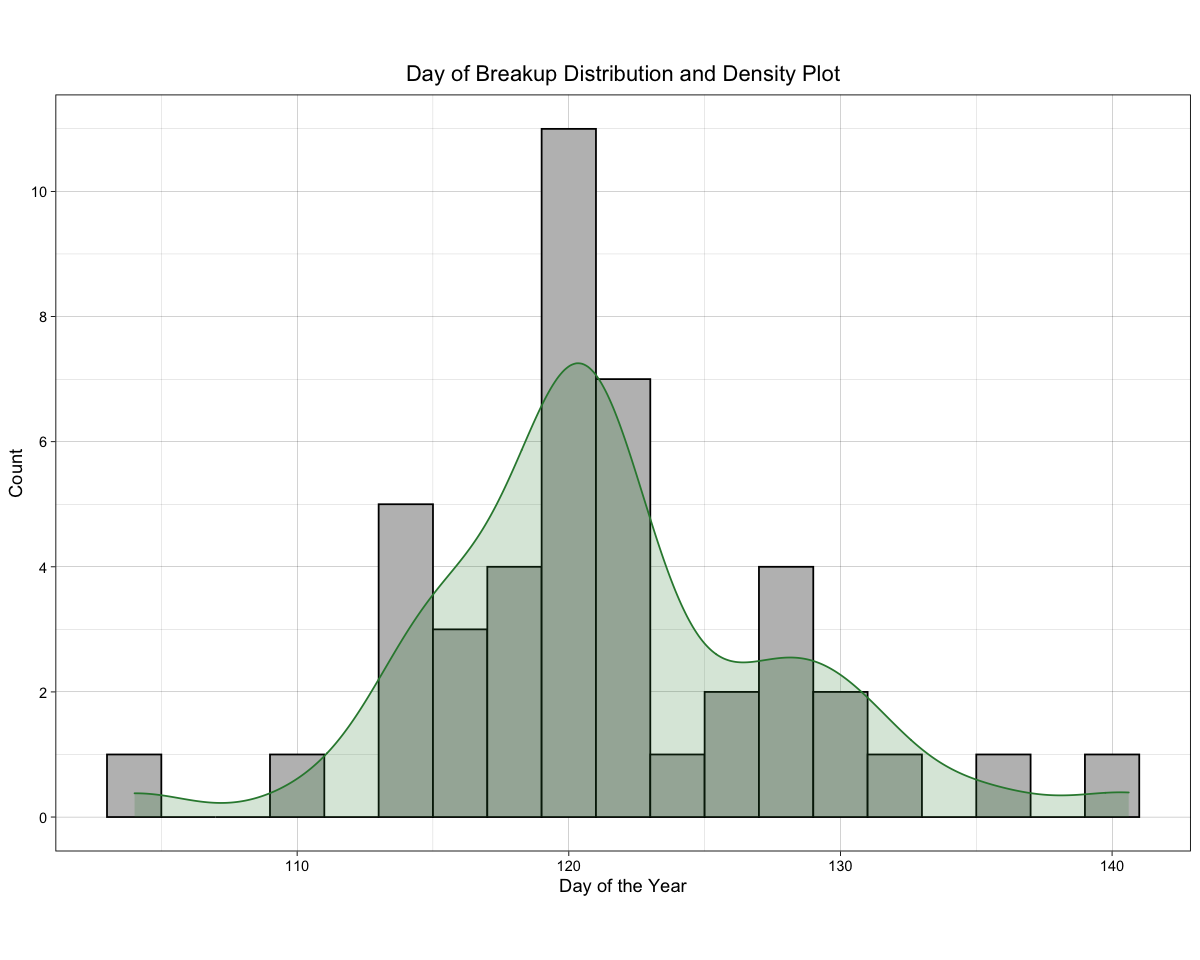
Looking at the histograms of the breakup date and time of day proved interesting. I added a density plot layer to smooth out trying to read the plots. For the day of the year, there is a peak around 120 days with a second smaller peak around a week later. For the time of day, it appears breakup peaks noon-4 pm and tapers off the rest of the evening and not typically occuring midnight-8 am.
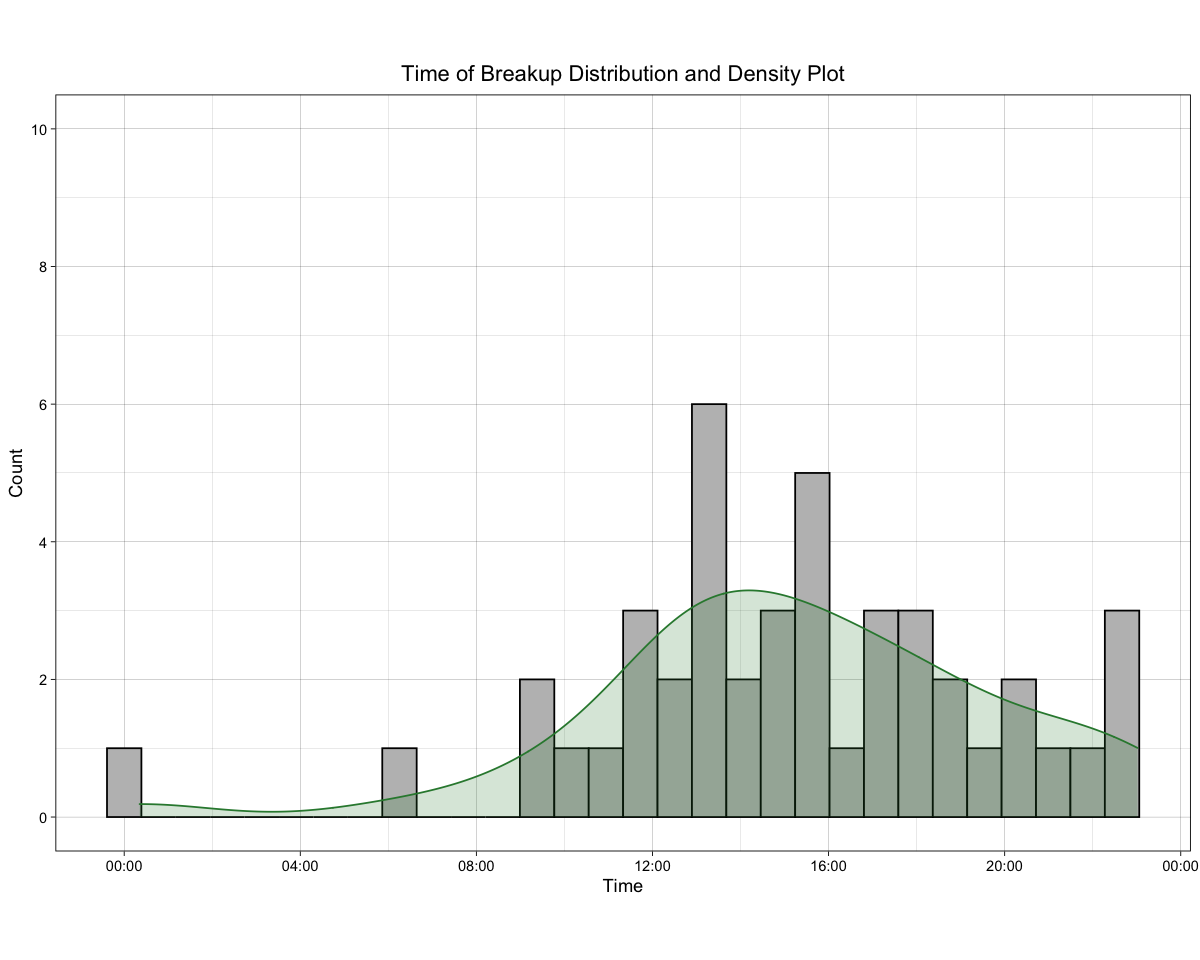
The Tenana River typically freezes between October and November each year3 and the last day to submit guesses is April 5th. I’ll use weather data from October 1st to March 31st (6 months) for the prediction intervals, but if you were to guess from historical data: the 121st day of the year (May 1st, or April 30th on leap years) sometime between noon and 4 pm would get you pretty close.
CBC Article: Alaska $350K ice jackpot goes to expert forecaster ↩︎
Nenana Ice Classic. Edited by W. N. Meier and C. F. Dewes. 2020. Nenana Ice Classic: Tanana River Ice Annual Breakup Dates, Version 2. Boulder, Colorado USA. NASA National Snow and Ice Data Center Distributed Active Archive Center. doi: https://doi.org/10.5067/CAQ58H42LQY2. 2022-02-16. ↩︎

Allyson is a highly motivated mining and mineral processing engineer with 15 years of experience. Her background is primarily in comminution and flotation optimization utilizing advanced process controls and expert systems.
She completed a Masters of Data Science from the University of British Columbia to hone and utilize her data science skills and subject matter expertise to transform the mining industry.
Her research interests are concentrated on decentralized task allocation for haulage fleets and the use of advanced simulation and optimization for data-driven decision support.