A Little Exploratory Data Analysis
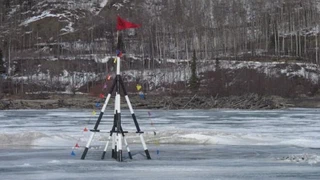 The tripod on the Tanana River.
National Snow and Ice Data Center
Since weather data for Nenana is sparse before 1977, I’ll only be using weather data from then to the present. Below, I’ve replotted the Tenana River ice breakup dates. The year 1978 is marked with a vertical dashed red line, and the bold horizontal line is the mean break up date for 1978-2021 (which is the 121th day of the year, or May 1st).

I’ve created a density plot of the breakup dates by time period below in Figure 2. You can see the mean breakup date for 1980-2021 is approximately three days earlier than the average for the entire period.

Looking at the histograms of the breakup date and time of day proved interesting. I added a density plot layer to smooth out trying to read the plots. For the day of the year, there is a peak around 120 days with a second smaller peak around a week later. For the time of day, it appears breakup peaks noon-4 pm and tapers off the rest of the evening and not typically occuring midnight-8 am.


So, if you were to guess from historical data: the 121st day of the year (May 1st, or April 30th on leap years) sometime between noon and 4 pm would get you pretty close.

Mining Generalist ⛏️
AI Strategist & Evangelist 💻
Neurodivergent Unicorn 🦄
Allyson is a highly motivated mining and mineral processing engineer with 15 years of experience. Her background is primarily in comminution and flotation optimization utilizing advanced process controls and expert systems.
She completed a Masters of Data Science from the University of British Columbia to hone and utilize her data science skills and subject matter expertise to transform the mining industry.
Her research interests are concentrated on decentralized task allocation for haulage fleets and the use of advanced simulation and optimization for data-driven decision support.